
Guide to Monitoring LLMs with OpenTelemetry
Monitoring Large Language Models with OpenTelemetry enhances performance, controls costs, and ensures reliability in AI systems.

Want to keep your AI systems running smoothly and cost-effectively? Monitoring Large Language Models (LLMs) is crucial. Here's how OpenTelemetry, a flexible, vendor-neutral monitoring framework, helps you track performance, manage costs, and debug issues efficiently.
Key Takeaways:
- Why Monitor LLMs? Ensure reliability, control costs, and optimize performance.
- Why OpenTelemetry? It collects metrics, traces, and logs, integrates with tools like Grafana, and supports multiple programming languages.
- What to Monitor? Request volume, latency, token usage, costs, and error rates.
- Essential Tools: Use OpenLLMetry for LLM-specific metrics and Latitude for collaborative prompt engineering.
Quick Setup:
- Install OpenTelemetry using tools like OpenLIT.
- Configure metrics collection and tracing.
- Visualize data with Grafana or similar tools.
Start monitoring today to avoid downtime, reduce expenses, and maintain a great user experience.
Observability for Large Language Models with OpenTelemetry
Setting Up OpenTelemetry for LLM Monitoring
Requirements for Using OpenTelemetry
To monitor LLMs with OpenTelemetry, your team needs a solid technical foundation suited to LLM workflows. Here’s what you’ll need:
| Requirement | Description |
|---|---|
| Programming Skills | Experience with Python, TypeScript, Java, or Go, along with debugging know-how |
| LLM Framework Knowledge | Familiarity with LLM architecture, APIs, and tokenization metrics |
| CI/CD Experience | Skills in setting up and managing pipelines for monitoring integration |
Installation and Configuration of OpenTelemetry
You can set up OpenTelemetry using either automated or manual methods. Automated tools like OpenLIT provide a faster way to get started.
For Python-based applications, follow these steps:
-
Install the OpenLIT Package
Run the following command to install OpenLIT:
pip install openlit -
Configure and Initialize OpenTelemetry
Use this Python snippet to configure OpenTelemetry:
import openlit

openlit.init(otlp_endpoint="https://your-backend-endpoint", headers={"api-key": "your-key"})
Once configured, make sure to address common setup issues to ensure smooth integration and accurate monitoring.
Addressing Setup Challenges
Here are some frequent setup challenges and how to handle them:
- API Key Management: Store API keys in environment variables to keep them secure and simplify deployment across multiple environments.
- Trace Routing Issues: Double-check your backend endpoint configuration to prevent missing telemetry data.
Best Practices for Integration:
- Use auto-instrumentation to streamline the setup process.
- Implement strong error handling to catch and resolve issues early.
- Begin with small test requests before scaling up.
- Keep an eye on the telemetry pipeline's performance to ensure data flows smoothly.
For troubleshooting and validation, tools like Grafana can help confirm data collection and pinpoint configuration problems.
Key Metrics and Signals for LLM Monitoring
Monitoring Request Volume and Latency
Keeping an eye on request volume and latency is a must for tracking LLM performance. These metrics help teams spot system slowdowns and allocate resources better. Use monitoring dashboards to stay on top of these key areas:
| Metric Type | What to Monitor | Why It Matters |
|---|---|---|
| Requests and Queue | Requests per minute/hour, pending requests | Understand peak usage and system load |
| Response Time | Average, p95, p99 latencies | Detect performance slowdowns |
| Resource Usage | CPU, memory utilization | Gauge infrastructure demands |
On top of performance metrics, keeping track of token usage and costs is essential for managing LLM operations efficiently.
Tracking Costs and Token Usage
Token usage directly impacts operational costs, especially for teams using external APIs. Track metrics like tokens per request and overall costs by feature or team. Set up alerts to flag spending spikes and analyze usage trends to manage peak times and avoid unexpected charges.
Monitoring Error Rates and Debugging
Error monitoring is key to ensuring system reliability and smooth user experiences. OpenTelemetry's tracing tools can simplify identifying and fixing problems. Focus on these error categories:
| Error Category | Monitoring Focus | Action Items |
|---|---|---|
| API Failures | Connection timeouts, rate limits | Add retry logic, adjust rate limits |
| Token Errors | Invalid requests, context length | Tweak prompts, reduce context size |
| System Errors | Infrastructure issues, crashes | Scale resources, improve error handling |
Leverage Grafana dashboards to visualize these metrics and set up alerts for quick detection of issues. Contextual error logs can speed up debugging, while traces provide a full view of the request flow, making it easier to pinpoint root causes.
Advanced Techniques for LLM Monitoring and Debugging
Using Tracing and Span Management
Tracing and span management help you track requests across your system, making it easier to identify bottlenecks and debug issues. Tools like OpenTelemetry provide features such as distributed tracing, span context for adding metadata (like prompt length or model version), and trace sampling to focus on high-priority transactions.
| Tracing Component | Purpose | Implementation Focus |
|---|---|---|
| Distributed Tracing | Tracks requests end-to-end | Cross-service dependencies |
| Span Context | Captures request metadata | Token usage, model parameters |
| Trace Sampling | Optimizes performance | Filters high-value transactions |
You can configure span attributes to include LLM-specific data, such as prompt length or response tokens. This helps pinpoint latency issues or unusual behavior. Once you gather tracing data, visualization tools like Grafana can turn it into actionable insights.
Integrating with Visualization Tools like Grafana
Grafana works seamlessly with OpenTelemetry to build real-time dashboards and alerts for monitoring LLMs. Dashboards can focus on key areas like:
- Performance: Track response times and queue depths.
- Cost: Monitor token usage and spending trends.
- Errors: Identify failure rates and timeouts.
Utilizing OpenLLMetry for LLM Monitoring
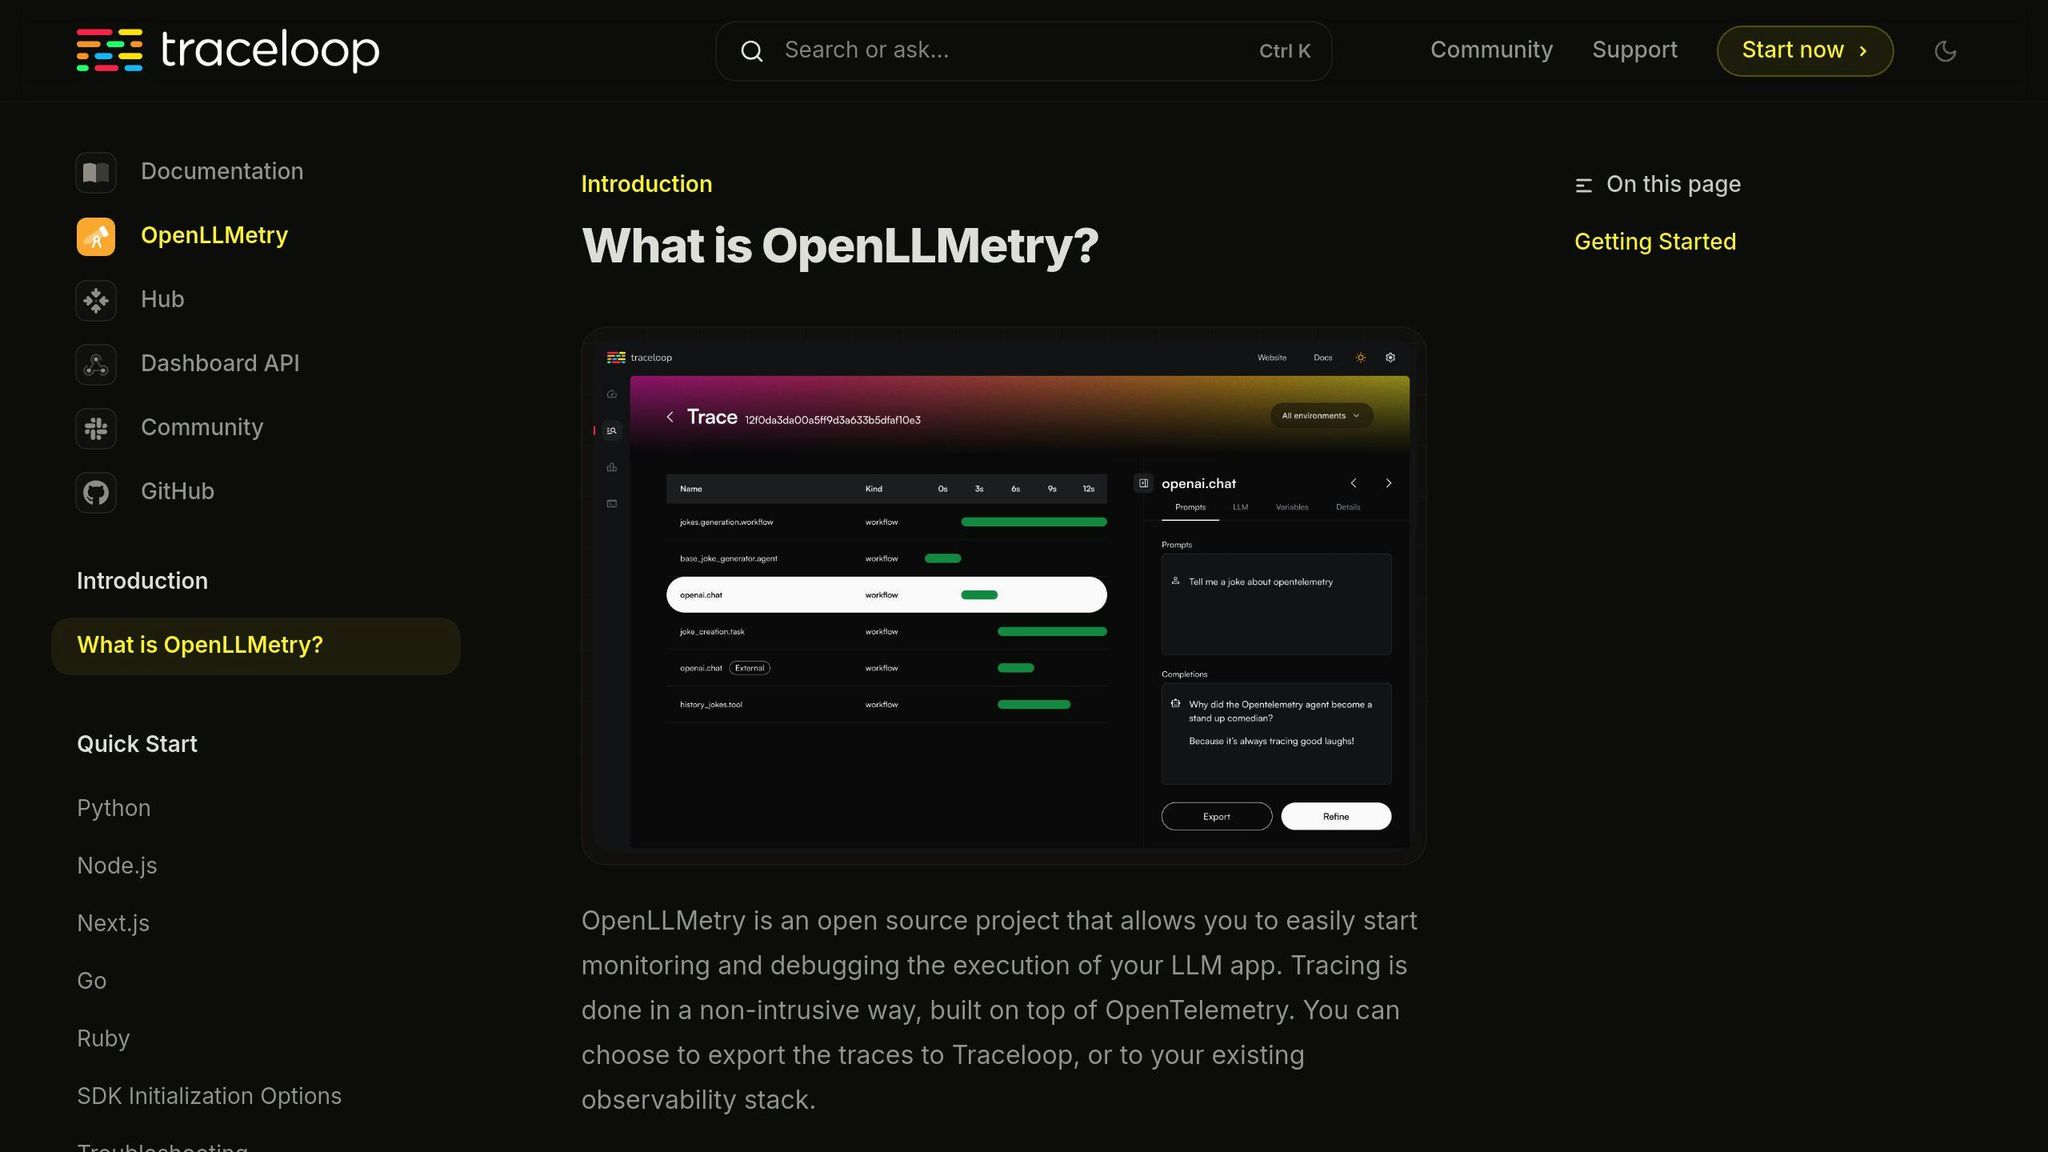
OpenLLMetry builds on OpenTelemetry by adding features tailored for LLMs. It offers:
- Automated Instrumentation: Simplifies setup and ensures thorough monitoring.
- Framework Compatibility: Works natively with tools like LangChain and LlamaIndex.
- Standardized Metrics: Ensures consistent tracking across different LLM setups.
Additionally, the OpenTelemetry community has developed GenAI semantic conventions, which enhance OpenLLMetry by introducing standardized practices specifically for LLM monitoring.
With tools like OpenTelemetry and OpenLLMetry, you can streamline monitoring and debugging processes, making it easier to collaborate and innovate on platforms such as Latitude.
Using Latitude for Collaboration and Prompt Engineering
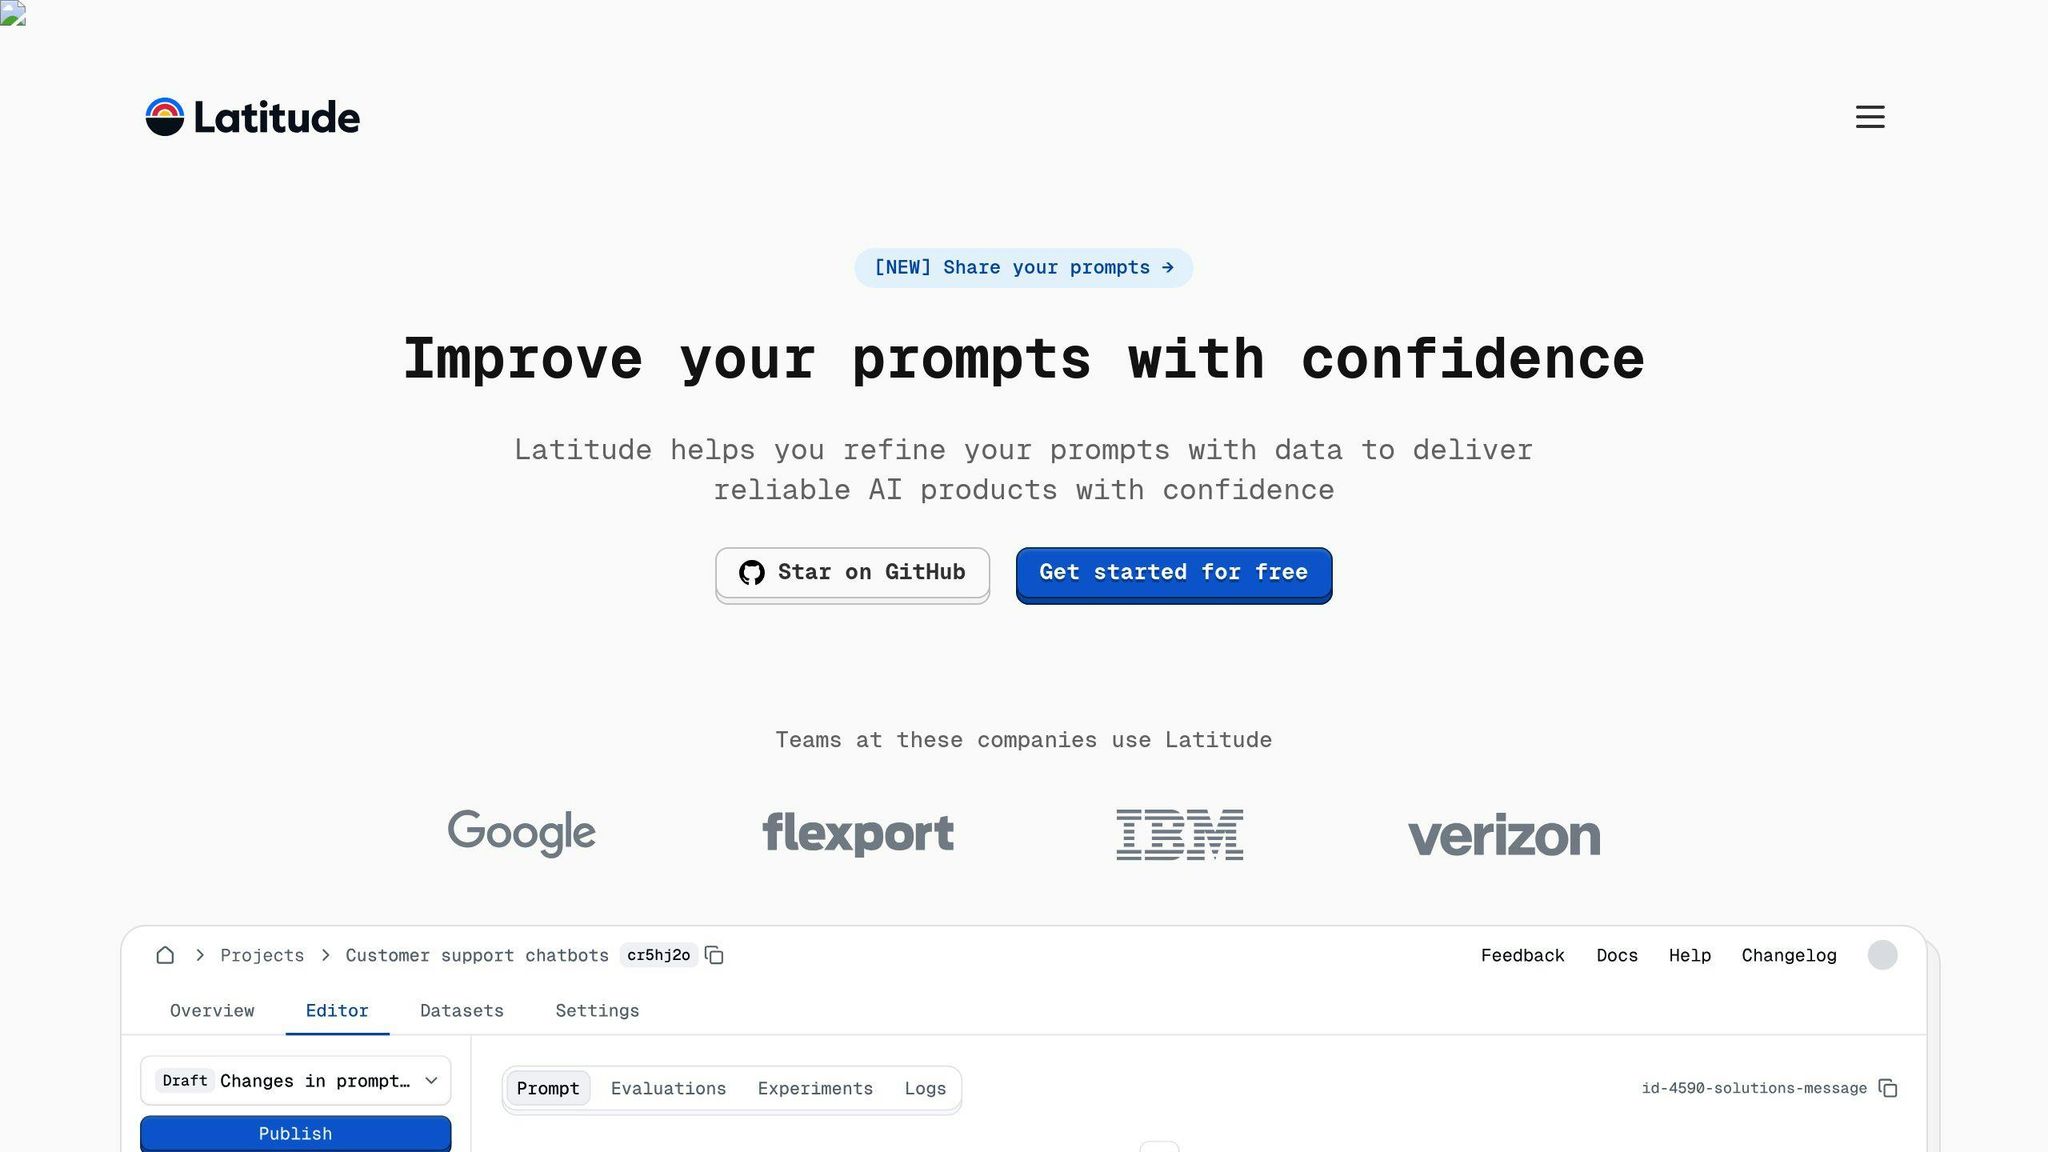
Introduction to Latitude for Prompt Engineering
Latitude is an open-source platform designed to bring domain experts and engineers together for developing large language model (LLM) features. It streamlines the process of collaborative prompt engineering, making it easier to create production-ready features. When paired with OpenTelemetry's monitoring tools, Latitude provides real-time performance insights, helping teams refine and improve their LLM outputs.
| Feature Category | Capability |
|---|---|
| Prompt Development | Version control and testing |
| Collaboration Tools | Team workflows and reviews |
| Production Support | Feature deployment management |
Ensuring High-Quality Features with Latitude
Latitude helps maintain reliable LLM features by offering tools for prompt versioning and testing. Engineers can:
- Keep track of different prompt versions and their performance metrics using automated testing.
- Observe feature behavior across various stages of deployment.
By leveraging Latitude's engineering tools alongside OpenTelemetry's observability features, teams can ensure consistent performance and reliability for their LLM applications in production.
Integrating Latitude with Monitoring Tools
Latitude integrates seamlessly with OpenTelemetry to provide a complete monitoring solution for LLM workflows. Here's how it works:
-
Performance Tracking
OpenTelemetry's tracing features offer detailed insights into the performance of prompts developed using Latitude. Teams can analyze response times, token usage, and error rates for specific prompt versions. -
Debugging Workflow
Monitoring alerts can pinpoint issues down to the exact prompt version in Latitude, simplifying debugging. -
Optimization Process
The integration allows teams to fine-tune prompts based on performance data. Changes can be validated using Latitude's testing framework.
This collaboration between Latitude and OpenTelemetry empowers teams to make data-driven improvements, ensuring that prompt engineering workflows are guided by real-time metrics. Together, these tools support efficient development and reliable LLM operations.
Conclusion and Actionable Insights
Summary of the Monitoring Process
Using OpenTelemetry to monitor LLMs involves a clear focus on key metrics and a structured method for data collection and analysis. This approach helps teams maintain performance and scale their LLM applications efficiently. The framework supports a wide range of monitoring needs, from basic performance checks to in-depth debugging.
Building an Effective Monitoring System
Here’s how to set up a monitoring system for LLMs using OpenTelemetry:
-
Set Up OpenTelemetry Infrastructure
- Use tools like OpenLIT for easy integration.
- Build pipelines to collect metrics, traces, and logs.
- Configure baseline monitoring settings.
-
Monitor Key Metrics
- Measure crucial data points like request patterns, response times, and token usage.
- Set up cost monitoring and alerts to track spending.
- Use distributed tracing for better visibility across services.
-
Add Visualization and Debugging Tools
- Use Grafana dashboards for live performance tracking.
- Include advanced tracing tools to pinpoint issues.
- Configure automated alerts for important metrics.
-
Regular Maintenance
- Update monitoring settings as your system evolves.
- Take advantage of OpenTelemetry updates and integrations like OpenLLMetry.
- Expand your monitoring setup as your LLM applications grow.
